180 000 products checked: why one nutrient is not enough
A new JRC analysis compares 180 000 packaged foods from 21 countries. It finds wide differences within product groups and shows how to make useful label comparisons.
On 7 October 2026, the European Commission’s Joint Research Centre presented an analysis of more than 180 000 packaged foods from 21 European countries and 5 product groups. The data are not a ranking of individual brands; they show how strongly comparable products can differ in sugar, salt, fat and fibre.
What the new analysis covers
Researchers examined breakfast cereals, bread, fresh dairy products and desserts, deli meats and similar products, and soft drinks. The Food Labels Explorer FABLE brings nutrition and labelling data from national surveys together. Survey periods differ by country, so the platform is a monitoring tool rather than a live shopping guide to every product on a shelf.
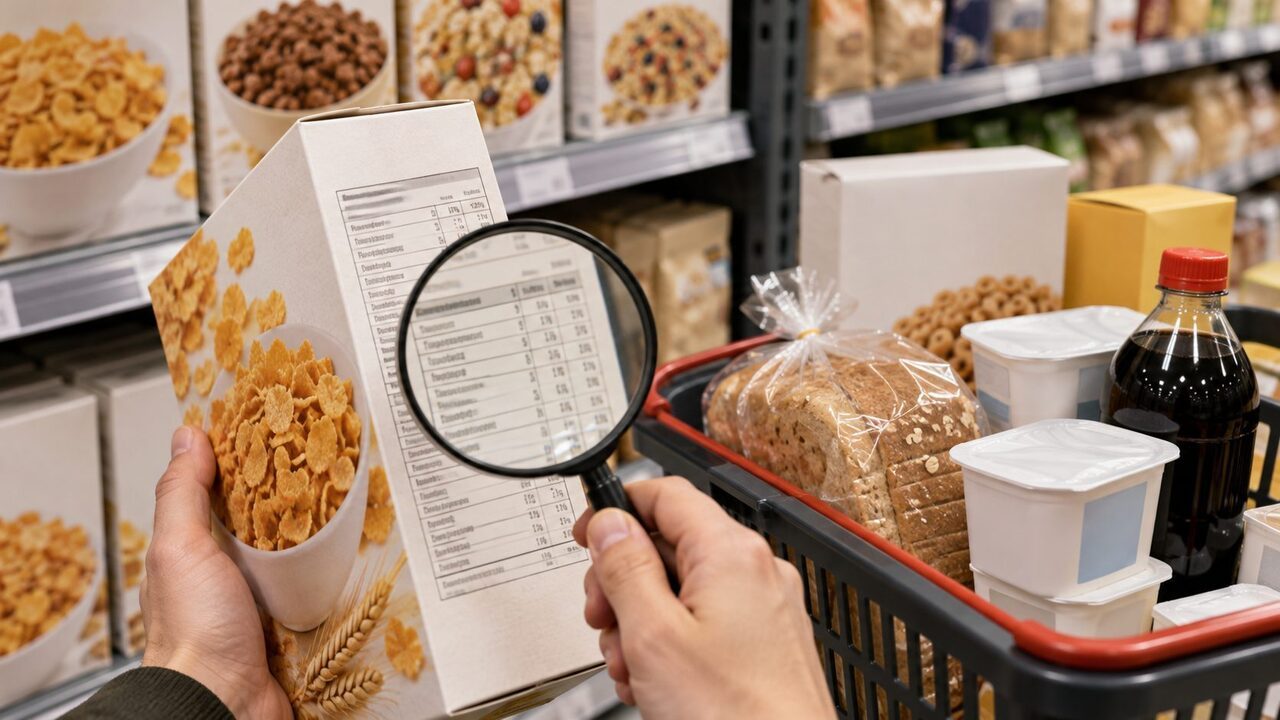
Comparison within a product group is the useful step. A drink cannot sensibly be judged against bread, but one soft drink can be compared with another and one cereal with another. When shopping, first choose the relevant category and then place the values per 100 g or 100 ml side by side.
Wide ranges inside the same product group
For breakfast cereals, total sugars in the analysis ranged from 1 to 28 g per 100 g. In deli meats, saturated fat ranged from less than 1 to 14 g per 100 g, depending on the product. These spreads explain why names such as cereal or cold cuts reveal little about the full nutritional composition.
The longitudinal data also reveal trade-offs. While sugars in cereals fell in most countries covered, total and saturated fat sometimes rose. An improvement in one value therefore does not automatically mean that the product has improved overall.
Two calculations from the report
The report illustrates the scale with everyday portions. Just 2 to 3 slices of ham in a sandwich plus 2 bacon slices in a salad can provide around 40% of the recommended maximum daily salt amount from the processed meat alone. A 330-ml cola with 40 g of high-fibre fruit cereal can exceed the recommended maximum daily free-sugar amount by more than 2 times.
These are model calculations using selected products and portions, not a claim about every sandwich or cereal. They do show why portion size and combinations matter: the table per 100 g helps products to be compared, while the amount actually eaten determines the meal’s contribution.
A practical way to compare labels
- Compare only products in the same category and use the standard values per 100 g or 100 ml.
- Read sugars, salt, saturated fat and fibre together instead of focusing on one highlighted number.
- Check the ingredients and portion size as well; front-of-pack claims do not replace the nutrition declaration.
- Judge the product in the context of the whole menu: frequency, quantity and combinations matter too.
FABLE can reveal differences and reformulation, but it does not decide which product is best for every person. Allergens, dietary needs, price and taste remain separate criteria.
Conclusion: compare first, then interpret
The new EU analysis carries a practical message: similar products may have very different compositions, and one isolated nutrient rarely tells the whole story. Put the figures into your own weekly plan with a breakfast recipe or a selection rich in vegetables.
Sources
- JRC: announcement on the nutritional quality of packaged foods
- JRC: scientific report and metadata
- JRC: Food Labels Explorer FABLE
Author: Kochzauber editorial team. Updated: 8 October 2026. This article explains monitoring data and does not replace personalised dietary advice.